Investigating Gumroad performance with ShakaPerf
A hidden iframe on our Gumroad demo downloaded the application just to send its parent a cart count. Replacing that response cut its median application transfer from 651,436 bytes to 2,497 bytes in our local captures. The median Lighthouse score stayed 94: we removed unnecessary browser work, but the experiment did not establish a score improvement.
This article follows our React on Rails Pro and Inertia integration, which introduces using Pro on selected pages in an existing Inertia application. Here, we explain how we investigated the demo: Google PageSpeed for the published comparison, ShakaPerf for a focused browser-work experiment, and functional checks before accepting a faster implementation.
Start with a question the measurement can answer
Our first task sounded small: remove an article's uncertainty about whether its two demo deployments used matching source versions. We needed to deploy the same commit to both hosts, select Inertia or React Server Components with a feature flag, and capture fresh reports.
The first new measurements did not consistently reproduce the older mobile RSC score of 80. We then had two questions: what explained the historical difference, and what could make the current page better?
Rolling back the code did not restore the old score. We also could not establish that a change in Google's test location caused the difference. The historical cause remains unresolved. Improving the page would answer the second question without necessarily answering the first.
We kept the October investigation separate from the September 23 ShakaPerf comparison, which used 20 paired measurements per viewport/cache case in seeded Docker environments. The samples, tools and environments described below are different.
Establish the deployment before measuring it
Both final deployments used commit 7f3557b in AWS Ohio, us-east-2. The rendering flag evaluated to off for seller luisfurushio on the Inertia host and on for the RSC host.
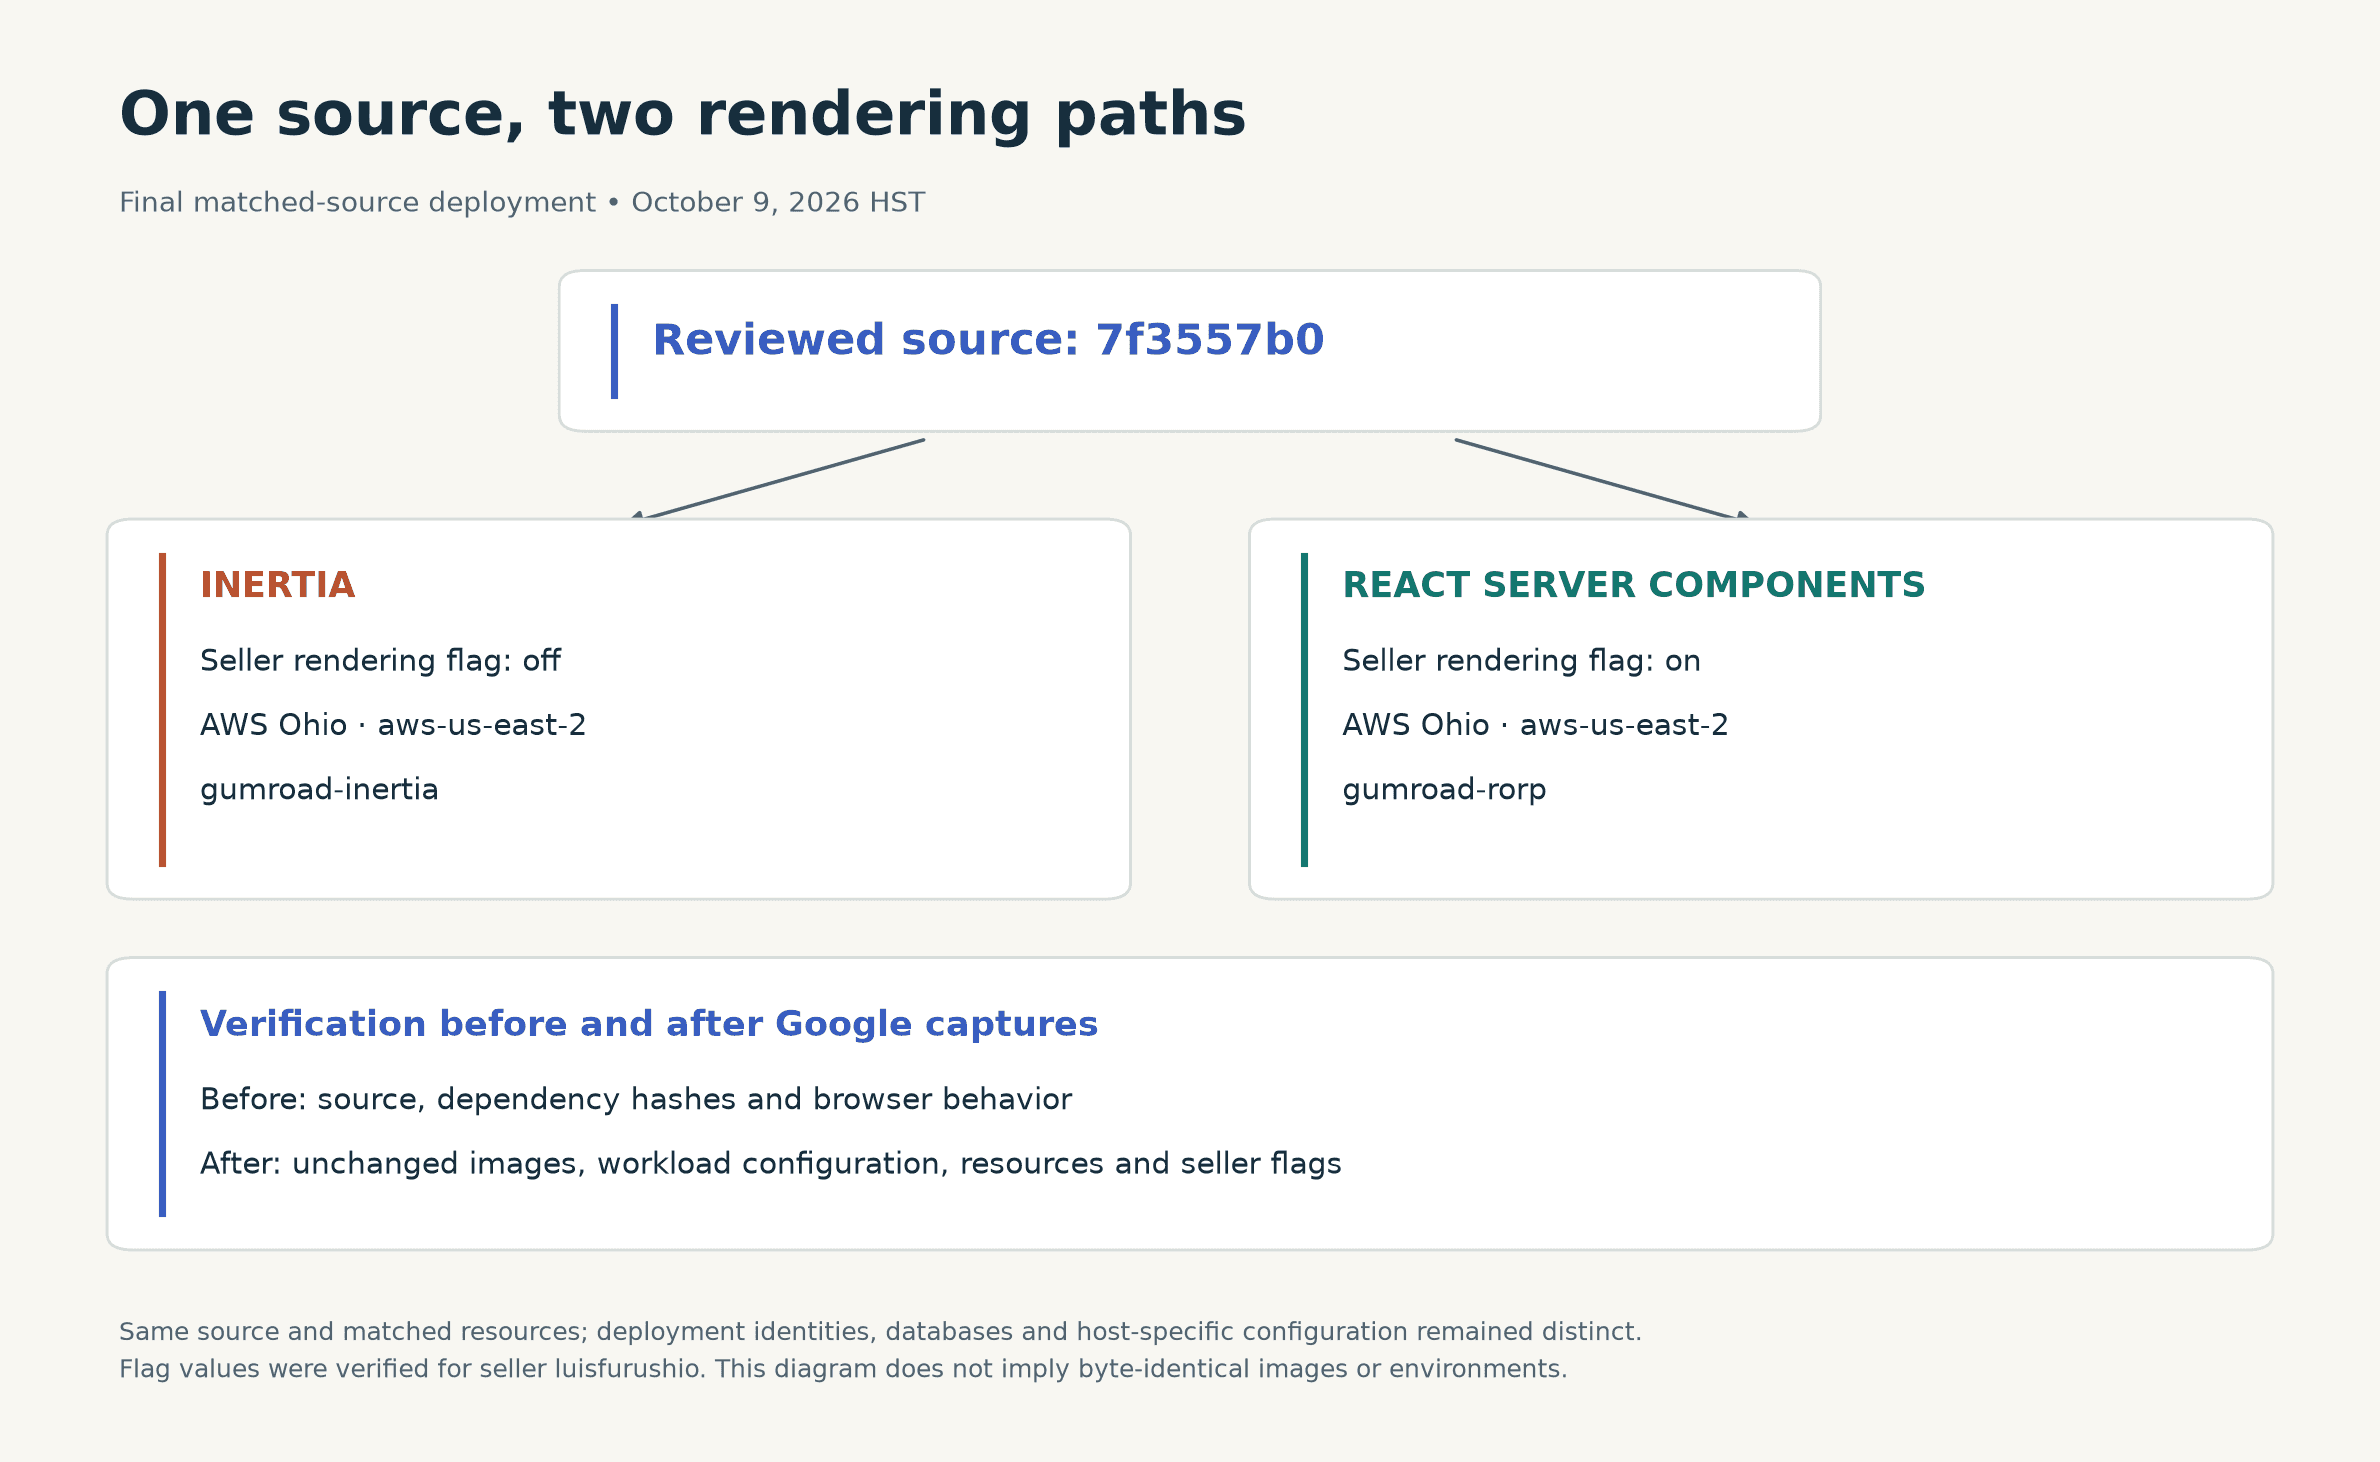
During the Google campaign, each host had one Rails replica with 1 CPU and 2 GiB of memory. Renderer and Sidekiq each had 0.5 CPU and 1 GiB. Adaptive sizing was disabled for Rails, renderer and Sidekiq. We checked source provenance, dependency hashes, the selected rendering path and browser behavior before capture, then checked images, settings and flags afterward.
The hosts retained separate deployment identities, databases and host-specific configuration. These were matched-source deployments with matched resources, not byte-identical environments. The deployment and measurement record lists the checks and limitations.
We used the same product path and query string on both hosts: /l/bgfjk?layout=profile&recommended_by=search. Before the final campaign, we loaded each page three times. Five earlier diagnostic loads had visited only the RSC host; we disclosed that asymmetry because its effect on the later measurements was unknown.
Warming an application server is different from warming a browser cache. The warmups reduced the risk of measuring a sleeping or cold application. They did not turn the subsequent Lighthouse captures into repeat visits with a shared browser cache.
Give Google and local tools different jobs
Google PageSpeed Insights made requests from Google's infrastructure to the live demos. Those are the reports in the final comparison below. Local diagnostics gave us access to request records and traces for narrower experiments.
| Measurement | Purpose | Setup |
|---|---|---|
| Google PageSpeed Insights | Compare the deployed implementations | 12 reports, Lighthouse 13.5.0, simulated throttling, North America shown in every report's browser-location tooltip |
| Local ShakaPerf cart experiment | Check what the iframe downloaded before and after its replacement | Five baseline and five candidate captures, ShakaPerf 0.1.4's installed Lighthouse 13.0.3 runner, Chrome 153.0.8010.36, Linux ARM, mobile emulation, simulated throttling, fresh browser profiles |
| Earlier local CSS experiments | Test a specific first-paint mechanism | Custom Lighthouse and Chrome DevTools Protocol experiments; separate evidence from the ShakaPerf cart work |
For the cart experiment, we invoked ShakaPerf's installed Lighthouse runner through a task-specific wrapper. This was not a stock shaka-perf compare campaign. Different hardware, versions and settings meant we could not combine local and Google scores or use one to predict the other.
We also had to distinguish an observed paint in a trace from Lighthouse's simulated LCP. Lighthouse can record a load and model its behavior under different conditions. An early observed paint does not establish that the simulated LCP must also be early. Google's throttling documentation explains the distinction.
Inspect the iframe, then preserve its contract
The cart-count iframe loaded ten scripts and one stylesheet before sending a message to its parent. The response needed a count, a storage-access check and the existing message format. It did not need the application bundle to do that work.
The replacement rendered a small HTML response with inline message code. It retained the cart-selection behavior, storage-access check and parent-message contract. The response also needed its Content Security Policy nonce and private, non-cacheable headers.
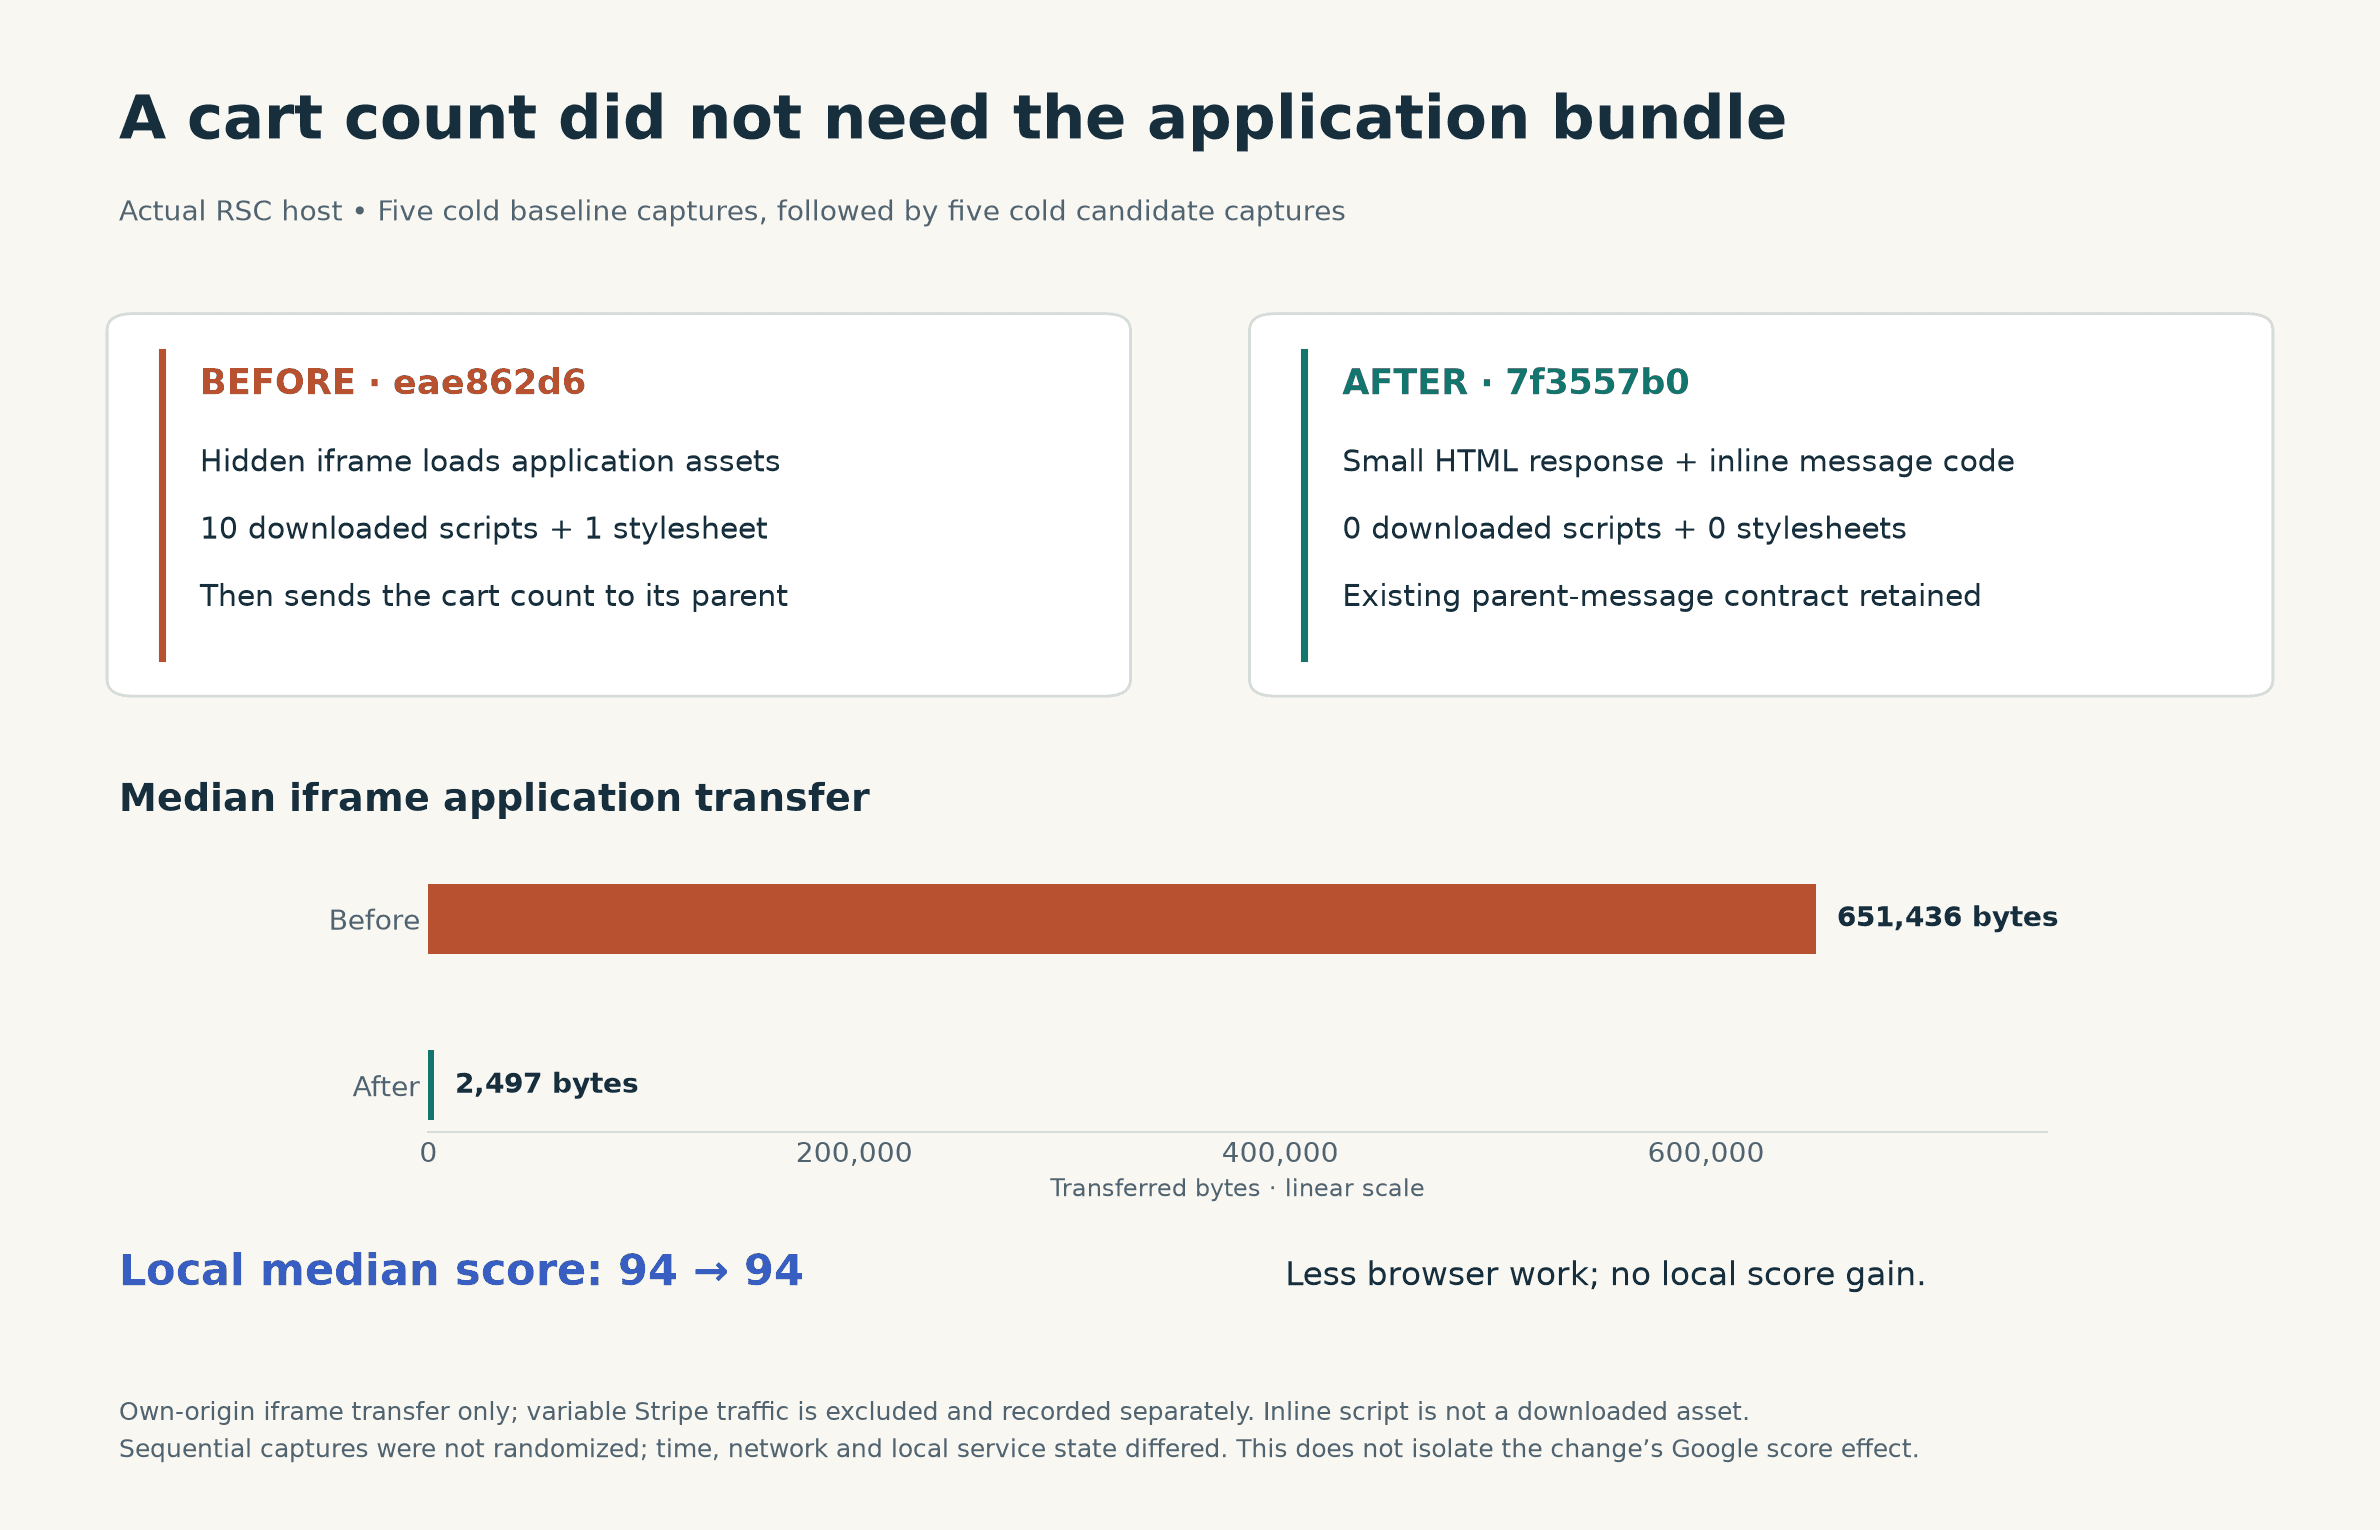
The local comparison used baseline eae862d6 and candidate 7f3557b deployed in sequence to the same RSC host. The local browser used a 412 × 823 viewport, 150 ms simulated RTT and 1.2× CPU slowdown. Five cold captures of each produced these medians:
| Metric | Baseline | Candidate |
|---|---|---|
| Iframe application transfer | 651,436 bytes | 2,497 bytes |
| Downloaded iframe scripts | 10 | 0 |
| Downloaded iframe stylesheets | 1 | 0 |
| Lighthouse performance score | 94 | 94 |
The transfer measurement covers the iframe's own-origin application traffic. Variable Stripe traffic was recorded separately. Zero downloaded scripts does not mean zero JavaScript: the small inline message script remained.
These captures were sequential, not randomized pairs. We removed idle local test-service containers between the baseline and candidate captures, so the machine's workload changed too. We did not treat small timing differences as causal evidence. In the baseline traces, the iframe's work occurred after observed LCP. The narrow result is that the replacement removed downloads; it did not raise the local median score.
This improvement applies to both Inertia and RSC, and both final Google-tested deployments included it, so it cannot be counted as an RSC-exclusive benefit.
Removing a bundle also removes whatever behavior depended on it. We checked more than an empty cart: on both live variants we added the English product, returned to see count 1, followed the cart badge to checkout, removed the item and reloaded to confirm it stayed empty. The checkout visit used no product query parameters, so it checked cart persistence rather than adding the item again. No purchase was made.
Five Rails tests passed with 45 assertions. Deliberately removing the CSP nonce made the relevant test fail. Those checks and the live cart flow increased confidence, but they did not certify payment completion or every browser's storage-access policies. The cart verification record describes the scope.
A faster first paint can have a cost
The investigation also tested earlier CSS delivery and keeping ordinary product descriptions static on the server. These changes belonged to the RSC implementation we measured; they were not enabled symmetrically on the Inertia path.
The CSS experiment inlined the existing design stylesheet. In three local pairs with a fixed 350 ms transport delay, median cold FCP/LCP changed from 2,524/2,524 ms to 412/616 ms. Repeat-visit medians changed from 400/400 ms to 412/412 ms. These were custom local measurements on an unthrottled ARM browser with a shared test fixture, not Google results. The fixed document delay did not model the transfer time of the added inline bytes; caches beyond the browser profile were not reset. We also did not test a preloaded external stylesheet. Both sides shared a stale replay error message, which limits conclusions about the whole page; the product image geometry matched.
Inlining added 26,295 compressed HTML bytes per navigation. Those inline bytes were resent with each document, even when the external stylesheet was already cached. The shared JavaScript still requested that stylesheet, so inlining did not remove its download on a cold visit. It also required URL rewriting, CSP handling and fallback behavior. A local cold-load benefit does not settle whether that complexity is worthwhile for a real mix of first and repeat visits. We kept this experiment subject to separate adoption review.
The description change avoided loading an editor just to normalize ordinary text and links. Interactive descriptions retained their enhancement path. An earlier attempt failed because hydration reset the intended lazy-loading attributes; we discarded that implementation instead of accepting its apparent benefit.
A shared cart improvement, an RSC-specific description change and a CSS-delivery experiment are different engineering decisions, and each deserves its own code review. Deployment machinery and measurement evidence also belong in their own PRs so a maintainer can adopt an application change without adopting our hosting setup.
Publish every run, with the limits beside it
The final Google campaign ran on October 9, 2026 HST, from 2026-10-10T04:39:45.177Z through 2026-10-10T04:43:51.830Z UTC: 4 minutes 6.653 seconds. We kept all twelve reports, with no retries or excluded samples.
| Implementation | Mobile scores | Mobile median | Desktop scores | Desktop median |
|---|---|---|---|---|
| Inertia | 51, 55, 53 | 53 | 75, 72, 72 | 72 |
| RSC | 96, 82, 86 | 86 | 99, 99, 98 | 99 |
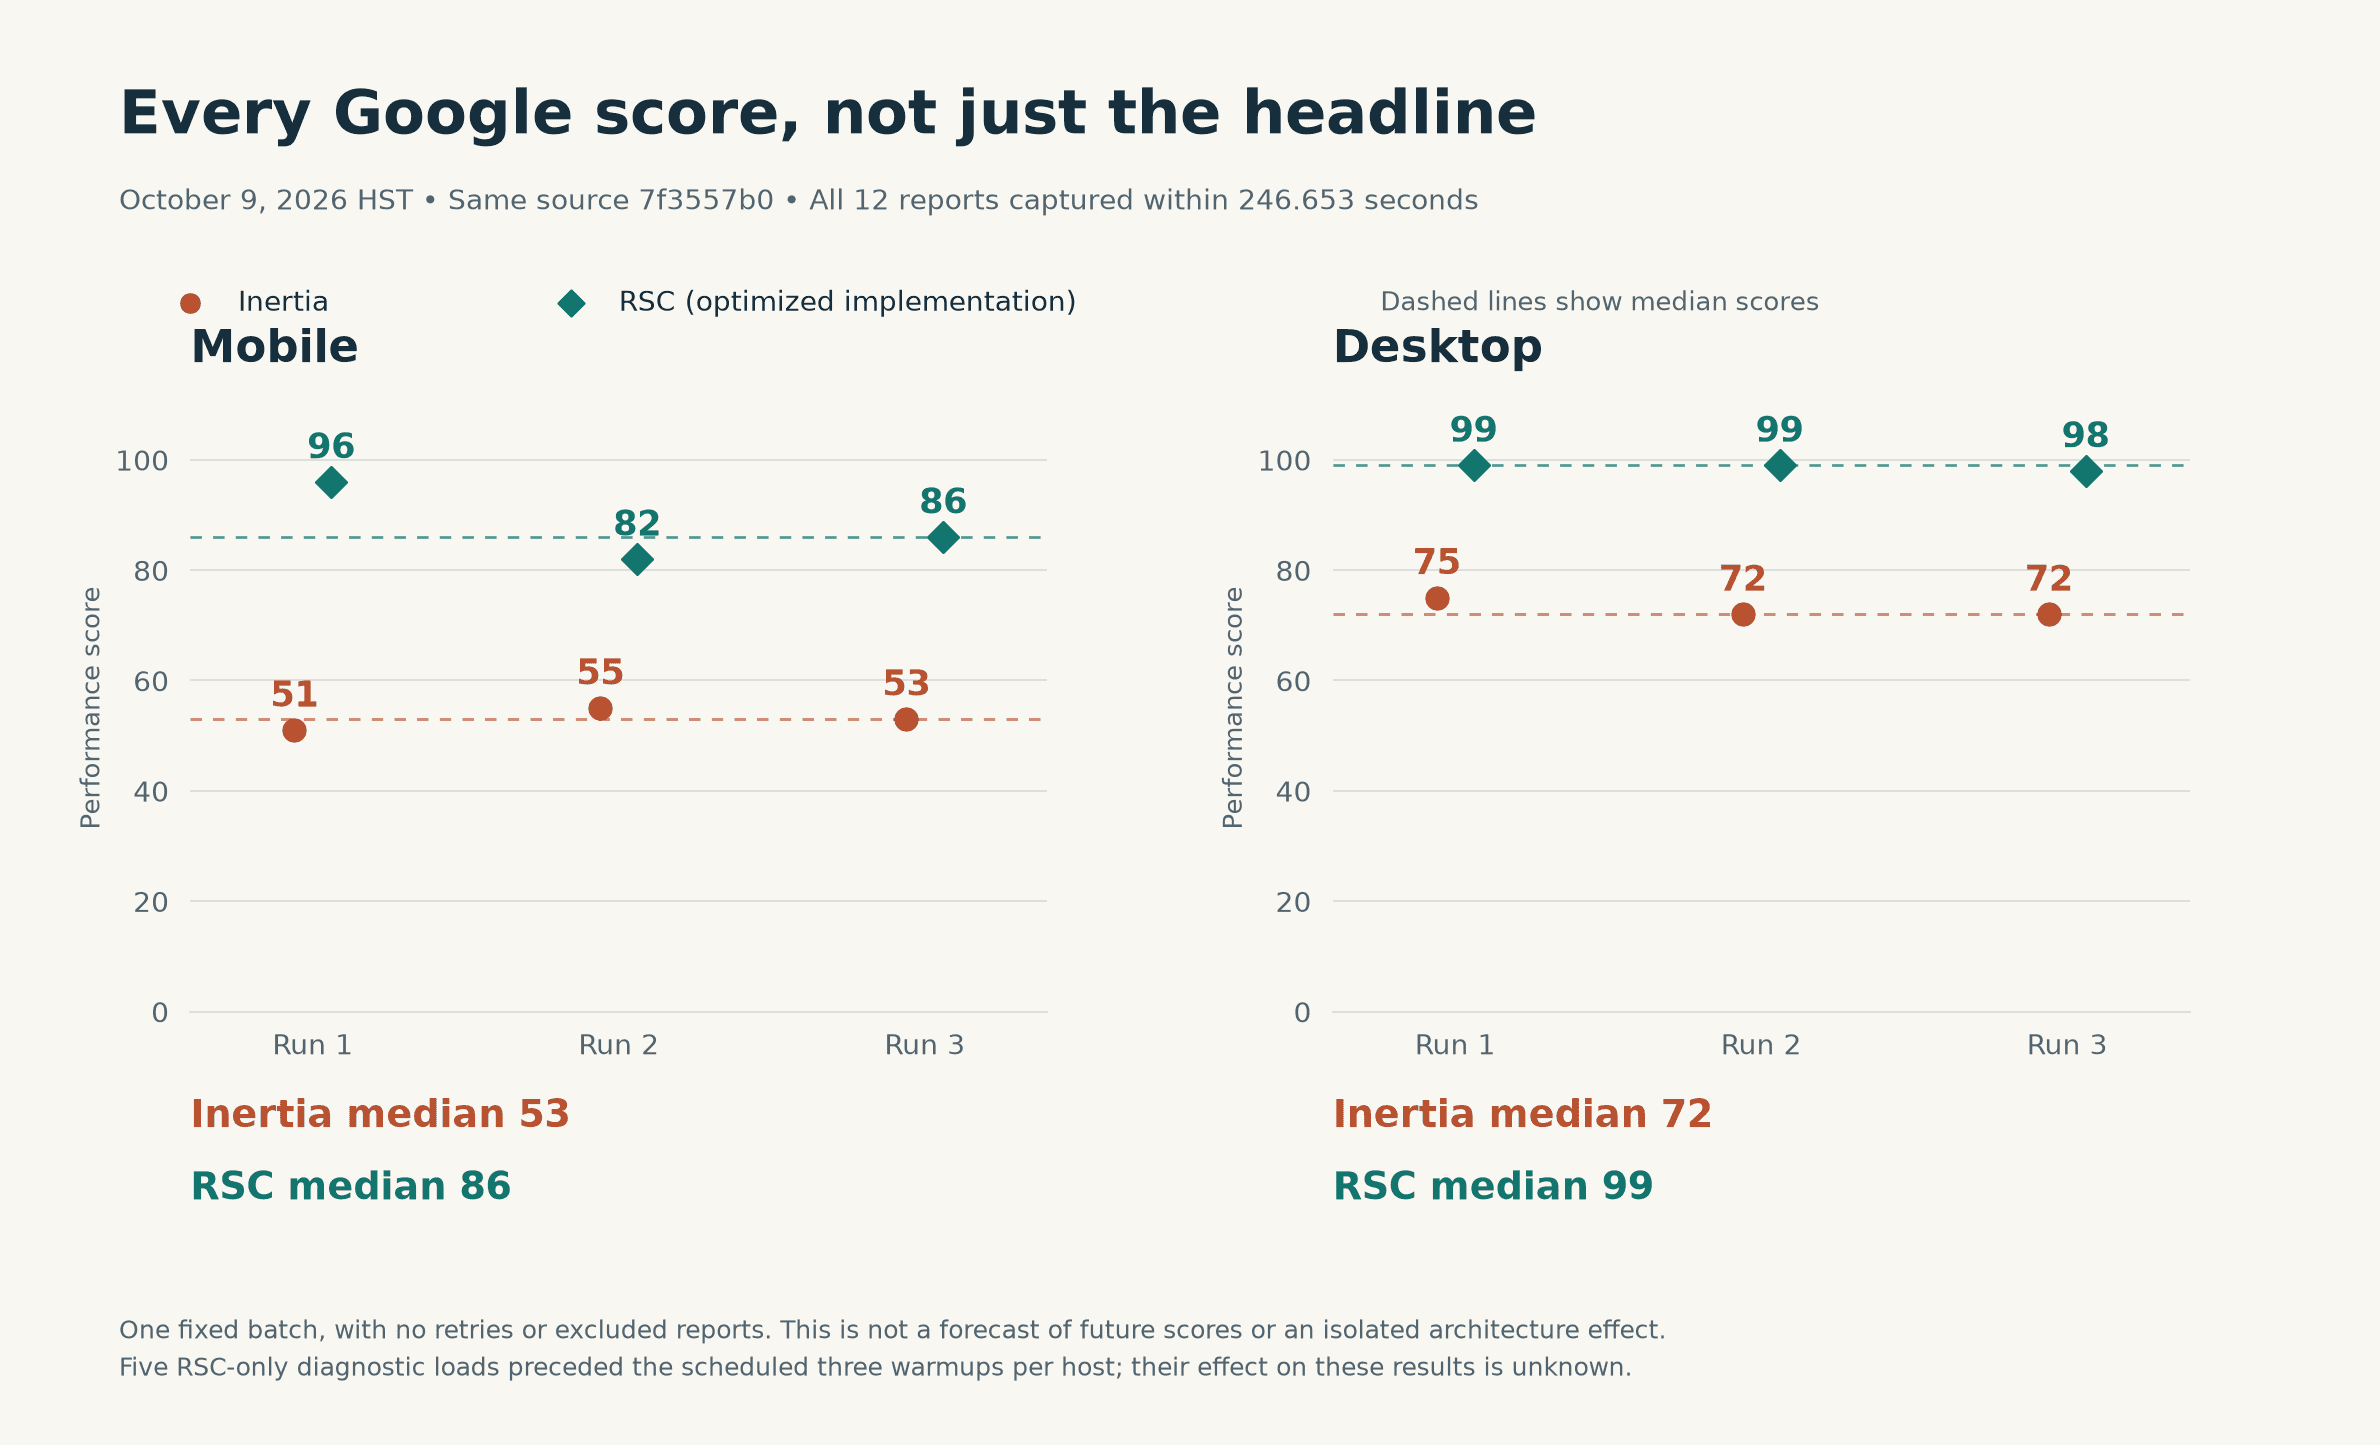
We selected the median before the final campaign to reduce the influence of an unusual run. The RSC mobile 96 is one of three samples; the figure we report is the median, 86. Three samples per combination describe this batch; they do not establish a stable score distribution. Google's Lighthouse variability guidance recommends repeated measurements and aggregation.
The 33-point mobile gap compares complete implementations. The Inertia host rendered on the client, as gumroad.com does today; Inertia's own server-side rendering was not enabled in this comparison. Matching commits establishes source provenance; it does not isolate RSC's contribution from the RSC-path CSS and description optimizations. We have not completed an independently optimized Inertia comparison. The later Google result also does not prove that the cart change caused an increase from an earlier campaign.
In the report tables below, FCP and LCP preserve the displayed report values; fetchTime comes from the report JSON. All times in the last column are UTC on October 10, 2026.
Mobile reports
| Host / run | Score | FCP | LCP | fetchTime UTC |
|---|---|---|---|---|
| Inertia 1 | 51 | 7.1 s | 11.4 s | 04:39:45.749Z |
| RSC 1 | 96 | 1.1 s | 2.6 s | 04:40:32.934Z |
| Inertia 2 | 55 | 7.2 s | 11.3 s | 04:41:25.448Z |
| RSC 2 | 82 | 2.0 s | 4.6 s | 04:42:12.417Z |
| Inertia 3 | 53 | 7.2 s | 11.4 s | 04:43:06.320Z |
| RSC 3 | 86 | 1.1 s | 4.2 s | 04:43:51.782Z |
Desktop reports
| Host / run | Score | FCP | LCP | fetchTime UTC |
|---|---|---|---|---|
| Inertia 1 | 75 | 1.5 s | 2.4 s | 04:39:45.177Z |
| RSC 1 | 99 | 0.3 s | 0.9 s | 04:40:32.901Z |
| Inertia 2 | 72 | 1.5 s | 2.4 s | 04:41:25.758Z |
| RSC 2 | 99 | 0.5 s | 0.8 s | 04:42:12.059Z |
| Inertia 3 | 72 | 1.5 s | 2.5 s | 04:43:06.255Z |
| RSC 3 | 98 | 0.5 s | 1.1 s | 04:43:51.830Z |
Keep a long investigation reviewable
An AI agent helped execute this work across builds, browser checks, tests and reviews. The useful discipline was maintaining a record another engineer could inspect: current commit, exact commands, report links, failed hypotheses, unresolved questions and next action.
Shaka supplied the delivery workflow: repository checks, validation records, independent review and PR walkthroughs. A benchmark-verification skill helped define the bounded baseline/candidate experiment. Browser checks tested the actual interactions. Independent workers could prepare prose or review evidence in parallel, while deployments and performance captures stayed serialized to avoid contaminating measurements.
The browser state was part of the experiment. We used fresh browser profiles for the cold cart captures and checked the request records instead of assuming that a test labeled "cold" had cleared every relevant cache.
Each experiment had to answer a named question, and each result had to be allowed to change our next action. So failed experiments stayed in the record, an earlier unresolved concern survived a favorable review, and a better score did not excuse a broken cart.
Reproduce the conditions before comparing the numbers
The benchmark used temporarily fixed resources. After the captures and cart checks, we restored adaptive sizing on Rails, renderer and Sidekiq without changing the application images. Adaptive sizing adjusts running resources; it does not shut the services down. The live demos' operating policy can therefore differ from the saved campaign.
Before repeating this comparison, verify the deployed commit and feature flags, restore matched benchmark resources, and warm both pages. If a deployment has been stopped, an operator may need to restart it; a browser refresh is not proof that it will wake automatically. Record cold starts separately rather than mixing them into a warm-server comparison.
For a new investigation, choose the outcome before running the experiment: less JavaScript, earlier LCP, lower server work or fewer regressions. Then inspect requests and traces, change one mechanism where practical, preserve functionality, and publish the unfavorable results alongside the favorable ones. A PageSpeed score is one piece of that evidence.
ShakaPerf and React on Rails Pro each have their own license, and one ShakaStack Pro subscription covers both. ShakaPerf helps investigate and verify changes; Pro lets you render selected Rails pages with server-side React and RSC. Whether a given change is worth its engineering and operating cost is still a judgment for each application.
Closing Remark


