Gumroad RSC experiment: technical reference and trade-offs


A buyer arriving at a Gumroad product page needs to read the product details and click Add to cart. In our repeated comparison, RSC delivered 8× faster first paint on cold visits than client-rendered Inertia. What changed, what did it cost, and how much can you infer from those measurements?
The main article shows the results and replays. Here I’ll walk through the rendering choices, test settings and trade-offs so you can judge whether a similar experiment makes sense for your app.
Why this page?
Buyers can land on a Gumroad product page from another website, Google search or an AI chat. On that first visit, the browser still has to load and run the application’s JavaScript. We chose this page to test two things: how soon buyers could see the product, and how soon they could click Add to cart. We did not measure sales or conversion rates.
Server rendering and SEO
Google Search runs JavaScript and can index client-rendered content. Other crawlers may need the content in the HTML the server sends. Google recommends server rendering or prerendering for users and crawlers, and notes that not all bots run JavaScript.
Both saved mobile PageSpeed reports scored 92 for SEO. Lighthouse checks basic SEO practices after rendering the page; that score tells us nothing about which pages Google indexed or how they rank. We did not audit Gumroad’s production indexing, search traffic or rankings. Sending product details in the initial HTML can help users and crawlers, and several server-rendering approaches can do that.
Early HTML is only part of the job
Traditional React server rendering lets a buyer see product details before the browser finishes loading JavaScript. To respond to a click on Add to cart, a React button still needs JavaScript and hydration.
React Server Components let content components execute on the server without shipping their implementation to the browser. Interactive controls remain Client Components. In our fork, React on Rails Pro streams server-rendered content while JavaScript continues loading for those controls.
Moving content rendering to the server changes the browser’s workload. Whether Add to cart responds faster still depends on where you draw the server/client boundaries and how you load and hydrate the client code. The purchase replay in the main article shows one recorded interaction. To check a button, we need to click it; paint timings alone cannot tell us when it works.
We compared RSC with client-rendered Inertia in September. We would need a separate matched test to compare it with Inertia SSR. The historical SSR experiment used different code and conditions.
What the repeated comparison measured
On September 23, we used ShakaPerf to compare the same seeded product content in separate Docker environments. Each row below summarizes 20 measurements of each variant. Both first and repeat visits used DevTools throttling: 100 ms RTT, 2,700 Kbps download/upload, 200 ms request latency and 3× CPU slowdown. The method notes describe the setup.
| Navigation | Viewport | Median FCP: Inertia → RSC | Median LCP: Inertia → RSC | Paired FCP reduction (95% CI) |
|---|---|---|---|---|
| Empty cache | Desktop | 9.53 s → 1.16 s | 9.53 s → 2.05 s | 87.8% (87.5–88.2%) |
| Empty cache | Mobile | 9.54 s → 1.16 s | 9.54 s → 2.07 s | 87.8% (87.5–88.1%) |
| Prepopulated cache | Desktop | 715 ms → 334 ms | 715 ms → 334 ms | 52.6% (51.1–53.7%) |
| Prepopulated cache | Mobile | 708 ms → 326 ms | 708 ms → 326 ms | 53.7% (52.5–55.0%) |
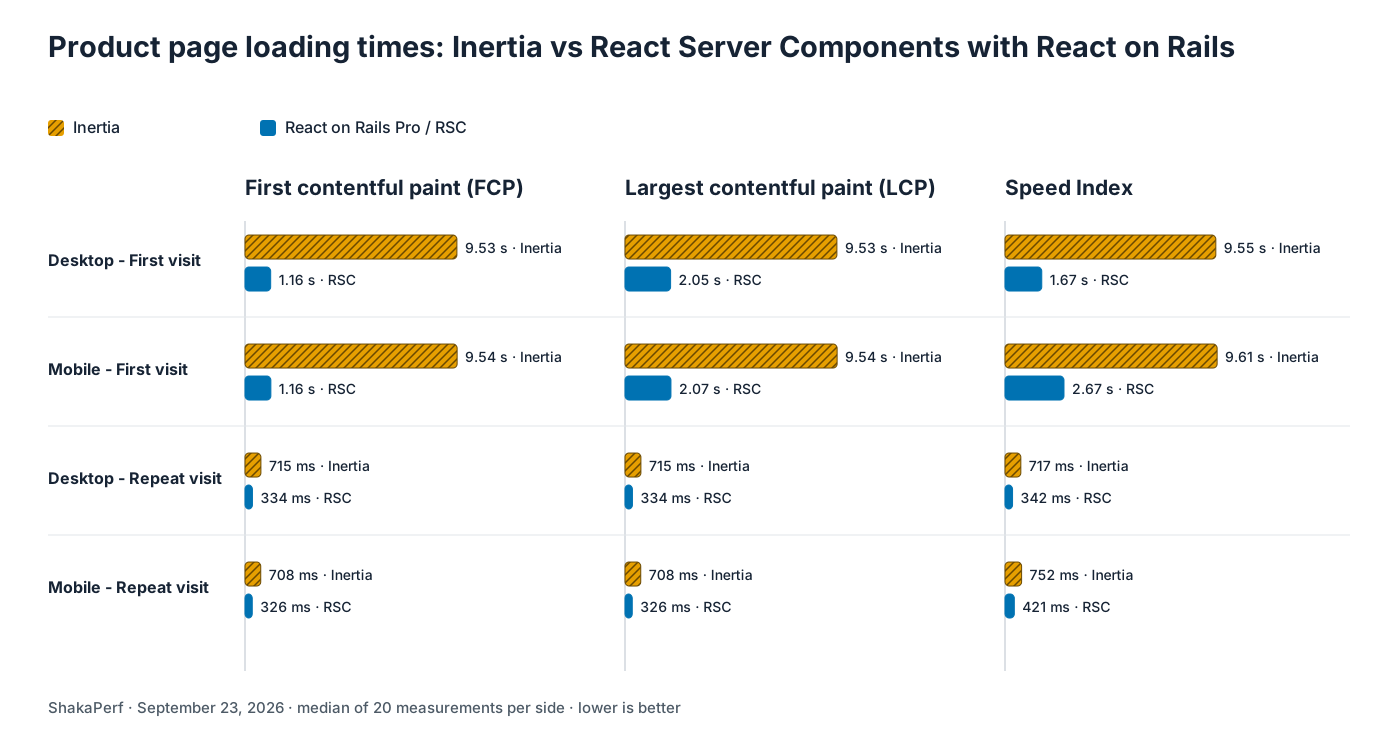
Across paired runs, RSC reduced cold First Contentful Paint (FCP) by about 8.4 seconds on both viewports. We calculated each pair’s difference before estimating the reduction, so it can differ from subtracting the two displayed medians. The full table includes absolute estimates and confidence intervals.
Repeat visits here mean full-page navigations with cached JavaScript, still under 3× CPU and network throttling. They do not measure Inertia's client-side navigation, which can reuse already-running JavaScript.
The costs sit alongside the faster paint
RSC painted content faster, but increased blocking time, time to first byte and transferred data on cold visits. The same September 23 run recorded these medians and paired estimates:
| Metric | Desktop: Inertia → RSC | Desktop paired change | Mobile: Inertia → RSC | Mobile paired change |
|---|---|---|---|---|
| Total Blocking Time | 11 ms → 119 ms | +109 ms | 12 ms → 121 ms | +110 ms |
| Browser-observed TTFB | 131 ms → 156 ms | +28 ms | 129 ms → 162 ms | +25 ms |
| Transferred data | 2,597.9 KB → 2,722.8 KB | +124.5 KB | 2,597.9 KB → 2,722.0 KB | +124.4 KB |
| Network requests | 143 → 96 | −47 | 143 → 96 | −47 |
With a prepopulated cache, transferred data fell by a paired estimate of 160 KB on each viewport, and requests fell from 142 to 95. Costs remained: median Total Blocking Time rose from 0 to 50 ms on desktop and from 0 to 42 ms on mobile; paired TTFB increases were 20 and 23 ms respectively. See the trade-off tables for confidence intervals.
RSC also adds a Node renderer service. It needs deployment, resource sizing, health checks and monitoring alongside Rails. Browser timings do not measure that operational cost, server capacity or infrastructure spend.
I’d judge that extra complexity against what buyers gain on the page and what the team can maintain. Trying one route gives you a manageable way to make that decision.
What the PageSpeed reports show
Separate October 1 PageSpeed Insights reports scored 53 with Inertia and 80 with RSC on mobile. They use Lighthouse's simulated throttling, rather than the September comparison's DevTools settings. These are individual lab captures, not averages, a repeated-run range or real-user measurements. Times below are the reports' displayed First Contentful Paint (FCP) and Largest Contentful Paint (LCP) values. Both reports were captured on October 1, 2026; HST is UTC−10.
Mobile PageSpeed reports
| Measurement | Inertia | RSC |
|---|---|---|
| Performance score | 53 | 80 |
| First Contentful Paint | 7.1 s | 2.3 s |
| Largest Contentful Paint | 10.8 s | 3.6 s |
| Capture time (HST) | 00:52:10 | 00:50:38 |
| Saved report | Open report | Open report |
Desktop PageSpeed reports
| Measurement | Inertia | RSC |
|---|---|---|
| Performance score | 66 | 98 |
| First Contentful Paint | 1.4 s | 0.6 s |
| Largest Contentful Paint | 2.3 s | 0.8 s |
| Capture time (HST) | 00:52:11 | 00:50:37 |
| Saved report | Open report | Open report |
We cannot confirm that both deployments used matching source code when these reports ran, so the scores alone cannot tell us how much of the difference came from RSC. A later deployment inspection found different RSC package versions in the live variants.
Open a saved report and click Analyze again to test the URL shown in its input field. Keep the device selection consistent and retain each result. PageSpeed is a convenient independent way to inspect these hosted pages. Scores vary with the run and deployment state. The PageSpeed evidence notes record the exact timestamps and settings; the repeated local measurements above provide a separate view of the change. The two methods should not be combined into one benchmark.
A separate check on Gumroad's live site
On October 6, I checked a different product on Gumroad’s production site, using its Discover layout. The saved mobile report shows a Lighthouse performance score of 56 and SEO score of 92. Separately, its real-user Core Web Vitals assessment is Failed, with LCP of 3.2 s, INP of 106 ms and CLS of 0.07 over the latest 28-day period shown in that report.
The lab score comes from one test; the field assessment reflects real visitors over 28 days. This production page also uses a different product and layout from our fork. It shows another page worth investigating, but we would need to test that page to know what an RSC migration would change.
What changed, and what the checks cover
You can try React on Rails on one route in an existing Inertia application. In our fork, Rails keeps the business logic, and a feature flag enabled per seller selects the RSC Product route. Turn the flag off and the page uses Inertia again. That lets us test the product page while keeping the rest of the application on Inertia.
| Area | Change |
|---|---|
| Product component tree | Split content rendering from interactive client components. |
| Content and layout | Render with Server Components, streamed through React on Rails Pro. |
| Business logic | Keep it in Rails. |
| Rollout and rollback | Use a seller-scoped feature flag; disabling it restores the Inertia route. |
| Scope | Change Product pages using the profile layout; Discover-layout Products, seller Profiles, checkout and other routes stay on Inertia. |
The cold desktop and mobile screenshots matched with zero differing pixels. We did not capture warm visual checks. Those screenshots verify the appearance of the captured states; each purchase path still needs its own checks.
The cold accessibility comparison found 0 new and 0 fixed findings. Twenty existing findings were marked changed on each viewport: 19 critical and 1 serious. The raw records contain the same failure descriptions. The captured HTML differs in image URLs, generated IDs or the way inline styles were written. The existing accessibility issues remain. Warm accessibility checks were not captured. Inspect the classification and raw reports.
Inspect the evidence or try the pages
ShakaPerf runs the same Playwright scenario against the control and experiment, collecting Lighthouse measurements, screenshots, accessibility findings and network activity. It sampled both sides concurrently in each pair and analyzed the within-pair differences. That reduces sensitivity to shared host activity, but does not eliminate every source of noise. The setup is in PR #102.
The published September 23 summary leaves two gaps if you want to reproduce the run exactly. Its hashes identify the input files, but do not identify the application commit tested on each side. It also lacks memory and swap readings taken during the run, so we cannot tell whether the host was under memory pressure. The archived artifacts preserve what was measured.
| Demo | Product page |
|---|---|
| Inertia | Open the Inertia deployment |
| React on Rails Pro / RSC | Open the RSC deployment |
Live deployments change. The archived reports are evidence for their recorded runs, not proof that today's demos match those builds or each other in every dependency. Deployment sleep, cold starts and current traffic can also affect a new measurement.
To explore either page, open Chrome DevTools and choose Lighthouse → Navigation → Performance. Enable Clear storage for a first visit, keep the device and settings consistent, and run each variant several times. Record the URLs, timestamps, settings and every result. A local Lighthouse run uses your machine and need not reproduce PageSpeed's score.
LLMs change the cost of trying
LLM coding tools can reduce the work involved in trying an RSC migration. An assistant can trace a component tree, suggest which components belong on the server, update code and write checks. That makes a one-page experiment worth reconsidering if the migration effort put you off before.
Engineers still need to review those choices, check that buyers can complete a purchase and maintain the deployment. We did not measure developer time saved in this experiment. The Node renderer also needs ongoing operation, however you write the code.
Try one page in your own app
I’d start with one page. Choose a product or landing page where visitors wait to read the content or click a button. Measure the existing route, introduce RSC behind a feature flag, then compare how quickly the content appears and how soon visitors can take the next step.
Keep Inertia where it serves you well. Keep the RSC change if the improvement for visitors justifies the work to build and run it. The feature flag gives you a way back if it doesn’t.
Follow the Inertia migration guide and the migrating-to-RSC series. Use ShakaPerf to compare the result and inspect performance, visual and accessibility changes together.
React on Rails core is MIT-licensed. Pro is source-available and free for development, test, CI, staging and review apps, with a 45-day production evaluation per organization. Under the current license, ongoing production use is free for qualifying organizations below all three limits—10 paid full-time-equivalent people, $1 million revenue and $1 million lifetime outside capital, counted with affiliates—and for qualifying charities, schools and hospitals. Other production use requires a subscription. The pricing page links the authoritative eligibility definitions; use the license terms that apply to your version.
If you’re working through a similar decision, we’re happy to compare notes.
Further evidence
Closing Remark


