Moving 710 Million Time-Series Rows Off TimescaleDB Without Losing the Cache


The number that looked dangerous was 178 GB: the size of 710 million sensor and actuator rows if we moved them off TimescaleDB into ordinary Postgres tables on RDS. That sounds like a storage-budget problem.
It is not. It is a cache-residency problem.
On TimescaleDB the data occupies about 5.4 GB on disk including indexes, which nearly fits in RAM. The same rows as ordinary Postgres rows plus indexes are about 178 GB. That will not stay hot, so the historical scans that matter turn into cold disk reads.
The constraint is specific: AWS RDS for PostgreSQL does not support the timescaledb extension. This is not a TimescaleDB takedown - it is good technology doing exactly what it should. But when RDS is mandatory, the real question is not "can RDS store 178 GB" (of course it can). It is "can plain Postgres keep historical telemetry compact enough to stay in cache?"
The answer: pack the cold rows into JSONB, keep a small raw hot tier, and answer aggregates from summary columns instead of the packed blob. What follows is a design measured on a local Postgres 17 instance against production TimescaleDB numbers; the migration itself has not run yet.
Keep a hot window, pack the rest
The application already gave us a boundary. Its live queries only look back about six days, deliberately avoiding TimescaleDB's compressed data. That becomes a seven-day raw hot window on RDS: recent point lookups, snapshots, and latest-value reads keep using ordinary indexed rows, and closed days move into a compact history tier.
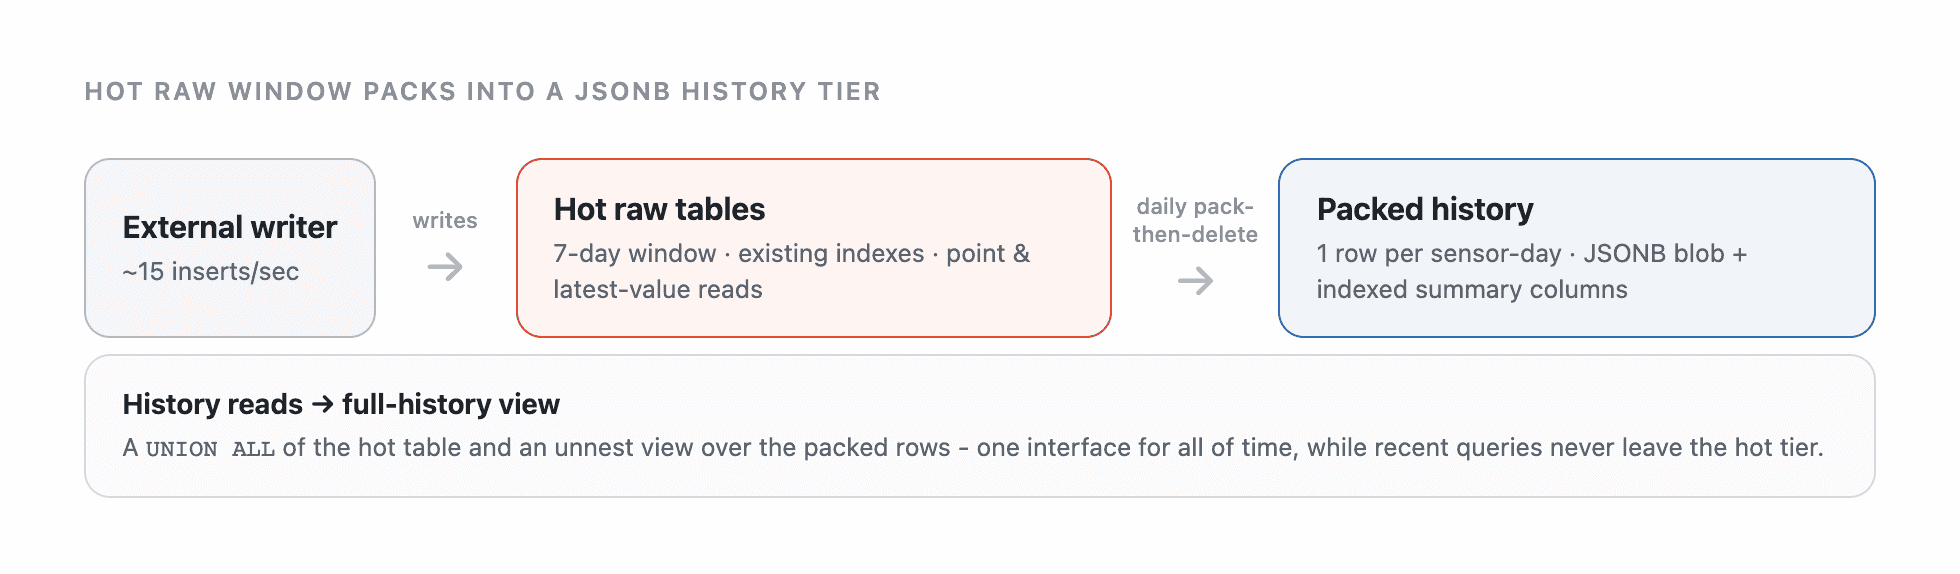
The write path stays simple. At a combined ~15 inserts/second, the external writer keeps appending raw rows while a Ruby job seals older days. The cold tier is not bolted onto the write path; it is a different representation for data the app already treats as historical.
Why per-row telemetry never compresses
My first instinct was to compress the existing rows harder. For this shape of data, you cannot.
Postgres TOAST compression only fires when a row exceeds roughly 2 KB. A sensor row - timestamp, text key, smallint, float8 - measures 56 bytes; an actuator row 52. Neither is close to the threshold, so LZ4 never runs on the individual rows. On top of that, each row carries a tuple header and four indexes, pushing sensor_data to about 248 bytes/row on disk. Asking TOAST to fix that is the wrong question, because compression is never invoked at all.
Packing solves two problems at once. One packed sensor-day replaces thousands of raw rows, deleting thousands of tuple headers and index entries - the dominant win - and the resulting tens-of-KB JSONB value finally crosses the TOAST threshold so LZ4 can compress its repeated structure.
We pack one row per sensor per day, which shares timestamps across a sensor's measures. The blob stays close to the original shape, and JSONB round-trips tricky float8 values (denormals, 6.022e23) exactly:
SELECT sensor_uid, day, n, min_v, max_v, first_at, last_at, data
FROM sensor_data_packed
WHERE sensor_uid = $1 AND day = $2;
-- data: [{"t":"00:00:20","m":8,"v":927.0269361111111}, ...]
Packing copies the useful part of TimescaleDB
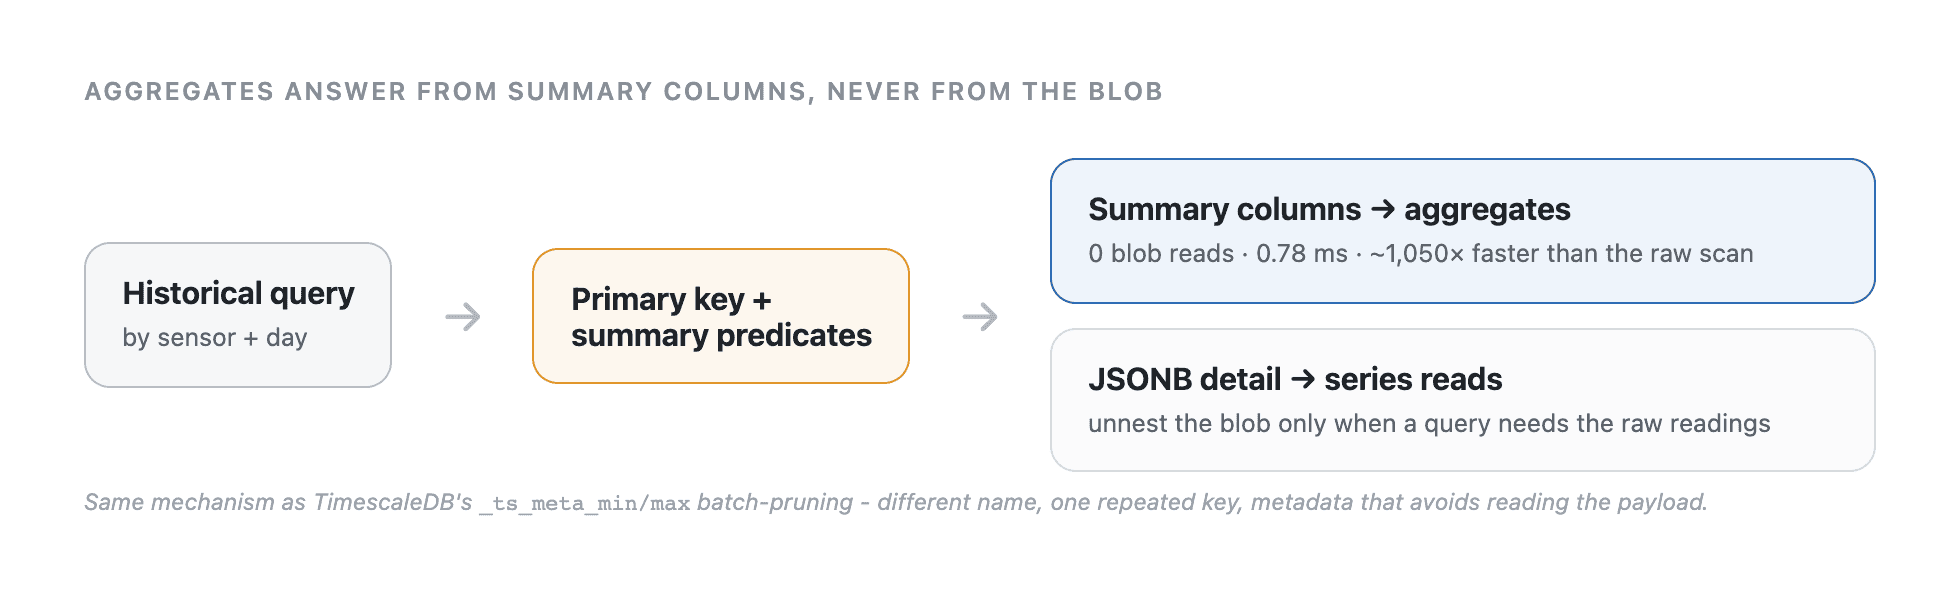
The convincing result was not that our JSONB design beat TimescaleDB. It did not need to. It reuses the same idea: group rows into a batch, store the repeated key once, and keep min/max metadata so most queries never open the payload.
The cold-cache comparison makes the parity concrete. For one sensor-day, on a test deliberately larger than the 128 MB shared buffer so cached results could not hide the difference:
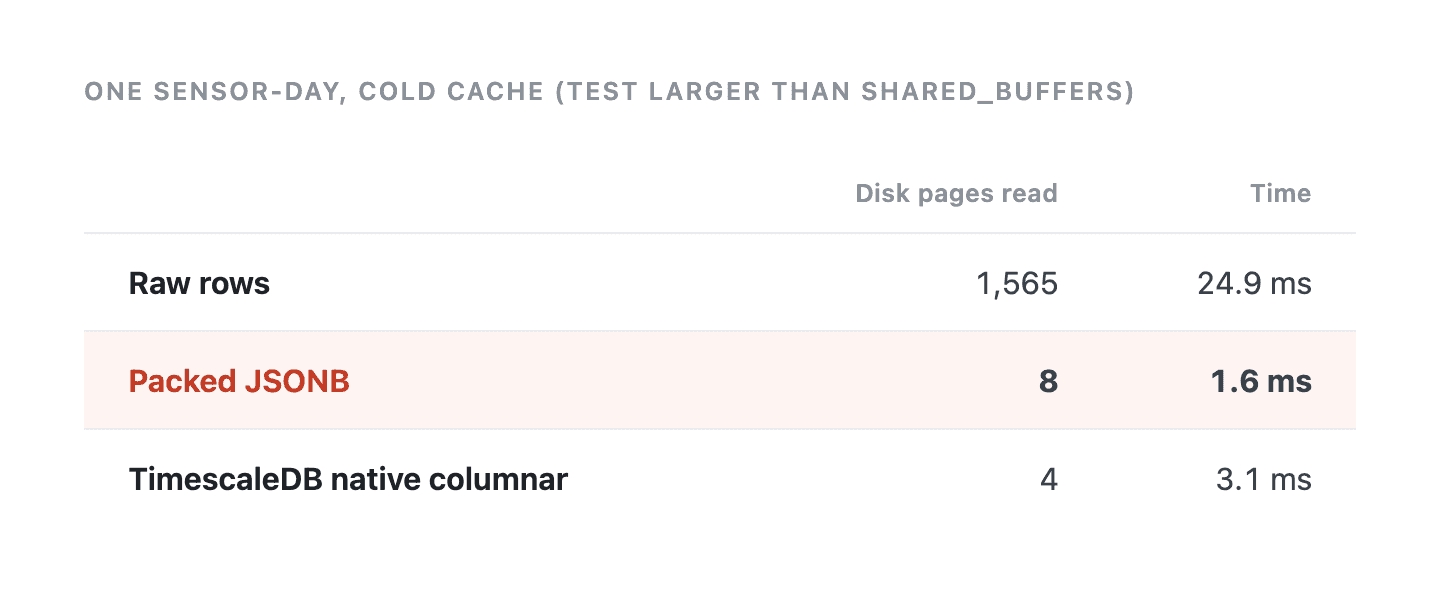
Raw rows read 1,565 pages; the packed row read 8; TimescaleDB read 4. Both compact representations keep the I/O footprint tiny enough for the cold query to stay fast. Ours is not a new columnar engine - it is a deliberately smaller idea: one large compressible value, one repeated key, and enough metadata to skip reading it.
The one rule: never unnest for aggregates
The rule I would put in large type above every query touching the cold tier: answer aggregates from indexed summary columns, never by unnesting JSONB.
In the 50-sensor average test, raw rows read 107,232 pages in 822 ms. The summary-column path read zero data pages and took 0.78 ms - roughly 1,050x faster. It is easy to misread that as "JSONB is fast." What actually happened is the aggregate never touched JSONB; it answered from precomputed metadata, exactly as TimescaleDB uses batch metadata to skip decompression. Unnesting is fine for a bounded series read (~1.6 ms per sensor-day), but the blob is for reconstructing detail, not routine analytics.
The encodings we turned down
Smaller encodings existed. We declined them because lossless reconstruction - full timestamp, full float8, text - was a hard requirement:
- Composite / 2-D arrays compressed worst of all: 11,807 bytes for a constant series where a values-only
float8[]took 87, because row-major interleaving hides the runs LZ4 needs. float4values halve the size but lose precision.- Delta-encoded timestamps are the biggest single lever (71 bytes versus 10,282 for a full
timestamp[]), but they move the blob away from raw and add a bespoke decoding contract we did not need. - An actuator event model would drop the 94.5%-heartbeat rows for ~1 GB instead of 1.4, but it is only state-lossless, not byte-lossless.
The trade, not a victory lap
Packed sensor history lands around 7 GB, plus ~1.4 GB of actuator history and a 2-3 GB hot tier: about 10-11 GB total, versus 178 GB raw. Stream-pack it straight off TimescaleDB during migration - never materialize the raw 178 GB on RDS first - and keep the old database authoritative until cutover so rollback is a connection flip.
This is not TimescaleDB-level compression: expect roughly 1.5-2x more disk, and you trade time_bucket for native date_bin. In exchange you get plain, extension-free Postgres with the working set small enough to cache. One honest caveat worth stating before anyone writes a migration job: if the mandate to leave TimescaleDB is soft, managed Timescale Cloud on AWS avoids this project entirely. But when RDS is non-negotiable, the right comparison is not raw Postgres versus TimescaleDB - it is raw Postgres versus a compact plain-Postgres representation with the same shape as a compressed batch. Framed that way, 178 GB stops being the scary number. The number that matters is whether the data stays in cache.
Aloha, Sergey
Closing Remark


